The goal of the first project I led at Cooper was to design a new trading application for a large online brokerage. After my teammate and I delivered the initial design, the very satisfied client extended our project and hired two additional Cooper teams to work on other products.
With the new application, the brokerage wanted to better serve their most lucrative customers—affluent, active investors who traded at least 100 times a year and who had at least $100,000 in their accounts. After interviewing customers and thoroughly researching the domain, it became clear that what these active investors needed was not more data and faster trades but more information and better tools for managing their complex accounts and tax liabilities.
One objective of our subsequent design work was to condense the many sources of information consulted by the investors into just a handful of screens. We also wanted to leverage the client’s knowledge of their customers’ past trades and current account balances in order to contextualize the information displayed by the application.
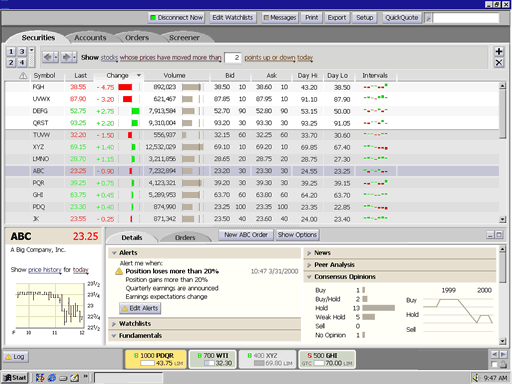
The screenshot to the right shows the Securities tab, where investors could track in rich detail the realtime behavior of stocks on their watchlists.
Instead of displaying long columns of undifferentiated numbers, the application design offered a visual representation of the data, helping investors quickly see outliers and trends in the data.
In order to help both the client and the design team better visualize how this dynamic interface would behave, I built a working prototype using HTML, JavaScript and PHP. As it was just a prototype, it works only in IE 5+ on Windows. If you are using that browser, you can launch the prototype to see the interface update with real—albeit 20-minute delayed—stock market data.
